

Test in Production: setting expectations on your services.
Instrumenting Application Behaviours with Monitoring tooling


A friend of mine tells a great story of a team avoiding a great deal of grief.
All of their system health checks were green. But their live graph of purchases dropped to zero and stayed there. Despite the many positive system indicators, the team was able to see they had a problem and were able able to react quickly to find and fix it.
It turned out that user purchases were a key indicator of success. Observing it saved them from an embarrassing day of support calls and explanations.
Knowing what's happening when your users interact with your software can save your ass; allowing your users to keep working and you to keep shipping.
All the metrics, logs, and test automation don’t matter if the customer can’t get their thing done.
If we want to know when our users can't reach their goals and act fast to fix problems we should:
- Instrument services, report fine detail of what happens as our users interact with the software in our live environment.
- Set expectations on this record of behaviour to check for successful outcomes.
In this post, I'll talk you through a simple way to instrument the application behaviour microservice, that allows us to observe, set expectations, and act on issues.
Instrumenting a microservice
Almost by default, most services get instrumented to send low-level data: HTTP responses (200s, 404s, 500s, etc). We also often have access to details on the database, disk, and throughput. These are usually done with some sort of monitoring plugin or service built around StatsD
If we want to know what's happening inside a (micro)service, we can additionally instrument the code to send out signals for both application events and error. These can then be used to alert the team when problems occur.
We do this in three ways
- Emitting high-level user goal progress and application actions
- Emitting high-level error states
- Emitting data when the code enters unexpected states
An easy way to start is through emitting error states.
Instrumenting application errors
When our code hits an error state, even if catch and handle it we often want to keep an eye on how often it's happening and take action if it happens too much. We do that by letting the metrics service know when errors were caught.
metrics.applicationError('failed_to_fetch_job_infomation');
This code will send a small piece of data to the monitoring service who will increment the count of failed_to_fetch_job_infomation errors.
Alerting on application errors
Once we have a microservice that emits errors and a monitoring service that counts them, teams can set expectations of what is right for the service. And be ready to receive alerts when they fail.
A starter approach an be to expect no errors from the service - monitoring that the error count remains at zero. Realistically all networked systems are going to have occasional failures, so for most errors, a threshold expectation gets set.
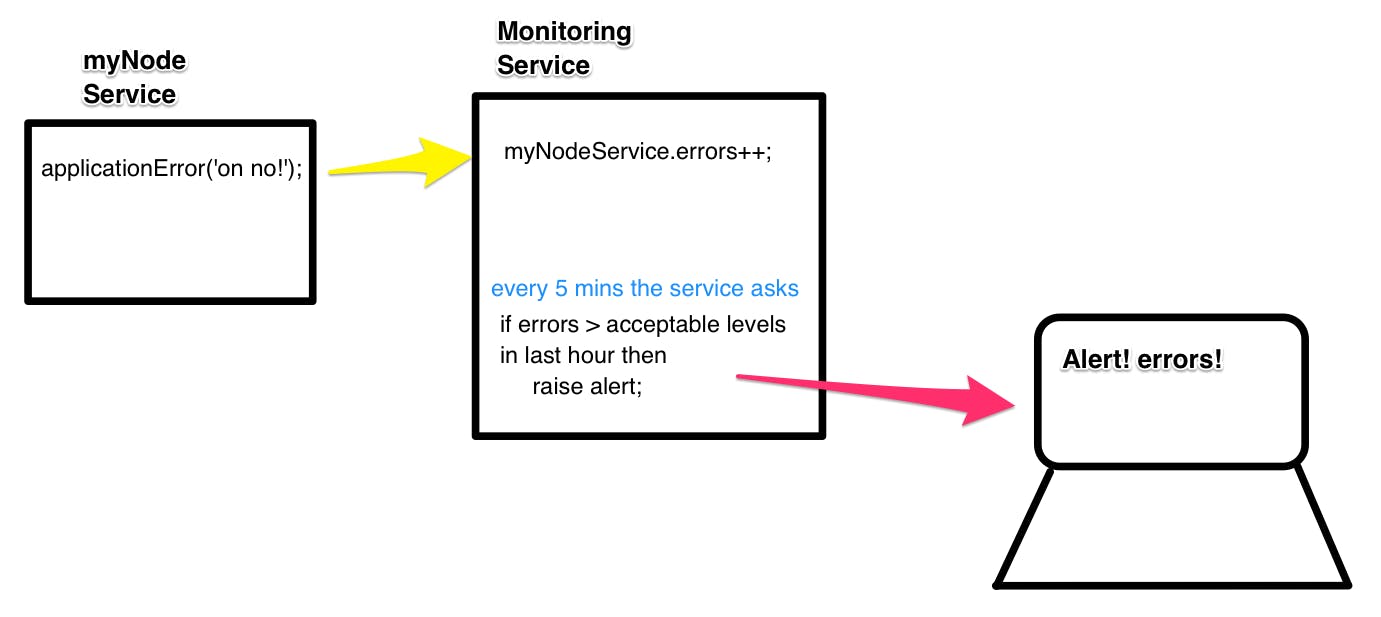
When an alert triggers, teams can get a message in their team chat room, talk and examine the issue, and make a choice as to how to act on it.
I'll dive deeper into the details of alerts and how these insights can improve how a team works in Part 3.
Instrumenting Application Behaviours
Sending application events
Application events are triggered in a similar way. When an important action happens in an application, we emit an application event.
metrics.applicationAction('application_submitted', applicationType);
As new features and code is added to a service, part of the job is working out what to emit that will help the team test and monitor the health of the feature.
Consuming Application events
Setting expectations about a service
With this data, we can set expectations on what should happen when a service is working as expected; alerting when the service is not behaving as we want.
Similar to how we reason when we write automated tests, in our monitoring service, we can state what behaviours we expect from the application. For example, we could expect that the count of application submissions does not ever drop to zero.
Many monitoring systems help you set up more complex assertions that take into context historical behaviours, or time of day
Managing corner cases through expectations
Rather than writing additional code for unlikely corner cases, or worse: dismissing and not accounting for them, we can use monitoring to let us know our assumptions are wrong or something has changed. Setting code up to emit monitoring data if they ever happen and alerting for these unlikely outcomes allows us to act on real information rather than conjecture and deal with changes that are out of our control.
Instrumentation got your back
Setting up monitoring expectations gives confidence that services continue to work as expected. As we keep releasing new versions, If a service starts to fail our users, we'll know.
This checking complements the tests that run before we ship a change, working to capture and manage known and unknowable faults.